


A 20-Year Journey of MGNREGA: Key Highlights in Ten Revealing Charts
Twenty years have passed since the law known today as Mahatma Gandhi National Rural Employment Guarantee Act (MNREGA)1 received the unanimous assent of the Indian parliament. Despite this unanimous political support, many economists had doubts about the soundness of the law at that time. No doubt, numerous implementation hurdles emerged soon after the Act came into force. Nevertheless, MNREGA’s experience so far is an important demonstration of the feasibility and sustainability of an employment guarantee Act, that too in a large country over an extended period.
This is a good time for collective reflection on the programme’s achievements, failures and future. As a starter, we present here a broad-brush overview of major MNREGA trends, based on official statistics, mainly from the programme’s Management and Information System (MIS, hosted at nrega.nic.in).
With rare exceptions, retrospective data for the early years of MNREGA (before 2014-15) are no longer available on this portal. This omission, intentional or not, is a major loss of evidence for the critical period when the programme was “learning by doing” so to speak. Fortunately, MNREGA data for that period can generally be retrieved from various sources. There is more than one way of doing that – we have done our best to use sources that are fairly reliable and also in the public domain.
An important milestone in the learning period was 2011-12. For that year, official estimates of employment generation under MNREGA are largely validated by two independent surveys: the 68th round of the National Sample Survey (NSS) and the second India Human Development Survey (IHDS-2) (Drèze 2014, Drèze and Somanchi (forthcoming)).
That year also precedes a series of amendments in the Schedules of the Act, in 2013 and early 2014, that significantly altered the implementation of MNREGA, notably in the direction of centralisation and digitisation.
Thus, 2011-12 will be a convenient reference year for some of the comparisons presented below.
Another useful reference year is 2023-24 – the latest financial year for which all relevant data are available at the time of writing.2
All the charts presented here are based on taking official MNREGA data at face value. It is more than possible that the official employment figures are inflated, in the sense that they include bogus work-days registered for the purpose of siphoning off MNREGA funds. This issue is discussed in a separate article (Drèze and Somanchi, forthcoming).
Employment generation
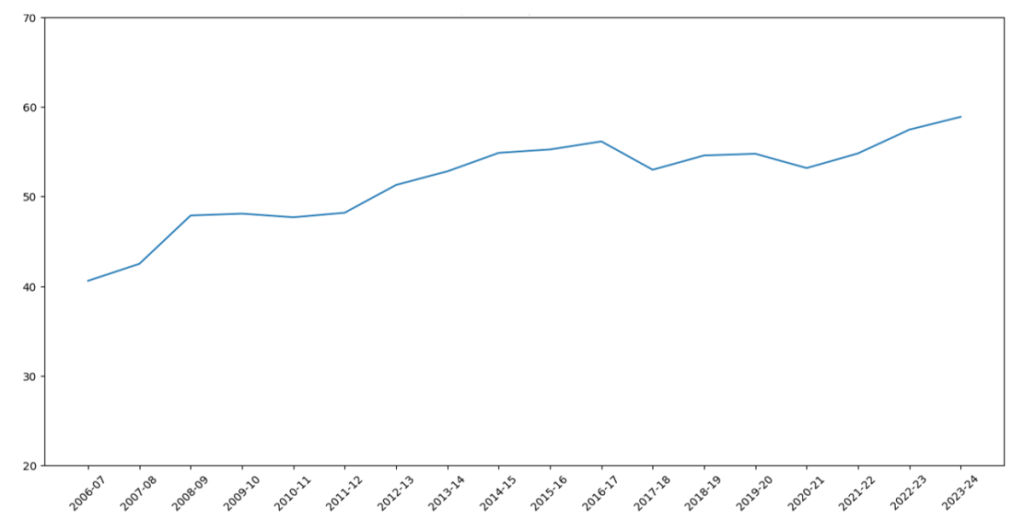
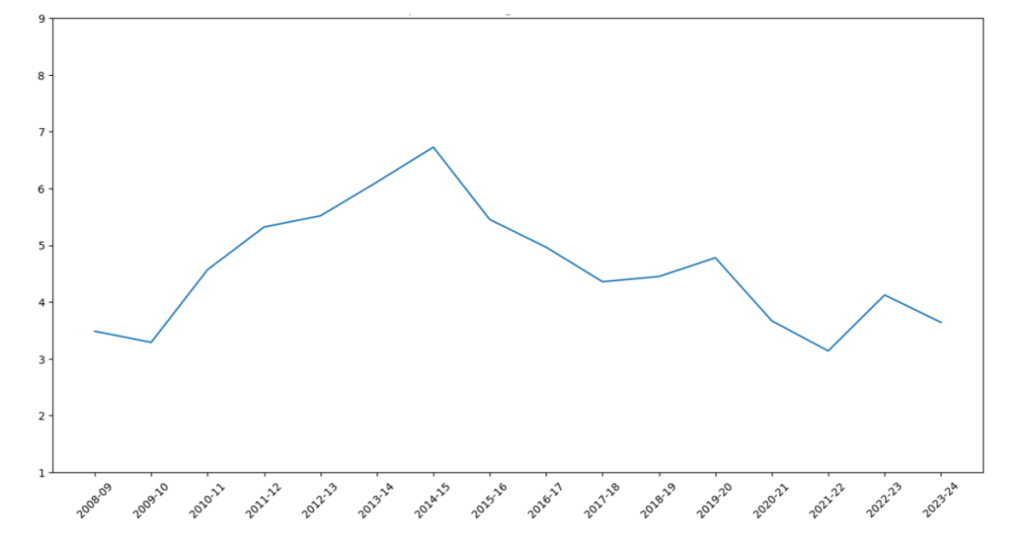
Figure 1 presents annual numbers of person-days of employment generated by MNREGA, starting from 2008-09 – the first financial year after the extension of MNREGA to the entire country.3
In most years, MNREGA employment generation was somewhere between 200 and 300 crore person-days. On two occasions, it shot up relative to preceding years: in 2009-10, just after the worldwide financial crisis, and in 2020-22, during the COVID-19 pandemic. This illustrates an important aspect of MNREGA: its countercyclical role. This role was particularly important during the COVID-19 crisis, when MNREGA provided critical fallback employment for unemployed workers and returning migrants.
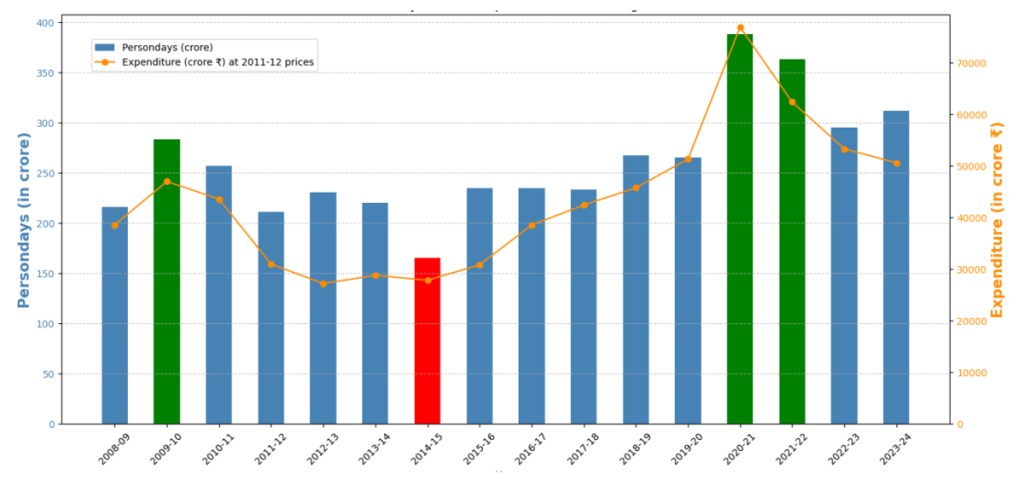
Employment generation fell below 200 crore person-days in just one year: 2014-15, when MNREGA person-days declined by 25% (to 166 crore person-days) compared with the previous year. This was the first year of the National Democratic Alliance (NDA) government headed by Narendra Modi.
It is possible that the 2014-15 crash reflects the initial hostility of the NDA government towards MNREGA, also evident in a short-lived attempt to restrict the programme to selected districts.4 Another possible reason is the rejigging of implementation guidelines that happened after sweeping amendments to the Schedules of the Act were made in January 2014 (just before the NDA government took office), including the imposition of “electronic muster rolls”.5
In 2023-24, MNREGA generated 309 crore person-days of employment. This roughly corresponds to 50 days of work, on average, for 60 million households (rounded official figures). In absolute terms, these employment figures are humongous, yet MNREGA employment is a small fraction of total employment – perhaps 2% or so.6
For specific groups or households, of course, MNREGA is a much more important source of livelihood than this national average conveys. In 2023-24, nearly five million households worked on MNREGA for a full 100 days, the effective ceiling for practical purposes.7
Figure 1 also presents annual estimates of Union government expenditure on MNREGA (about 90% of total MNREGA expenditure) at constant prices. Real expenditure closely tracks employment, as one might expect since real MNREGA wages stagnated from 2009-10 onwards (see below).8 As a proportion of India’s gross domestic product (GDP), central MNREGA expenditure peaked at 0.6% in 2009-10 and is much lower today – between 0.3 and 0.4% from 2015-16 onwards, except for a brief surge during the COVID-19 pandemic. This is a modest financial burden for an employment programme of this scale.9
Spatial distribution
MNREGA generates a large amount of employment at the national level, but the distribution of employment is highly uneven. In 2011-12, five states accounted for more than half of all MNREGA employment: Tamil Nadu, Andhra Pradesh, Uttar Pradesh, Rajasthan and Madhya Pradesh (in descending order of person-days). In 2023-24, more than 50% of MNREGA work took place in the same five states again, except for Bihar replacing Madhya Pradesh.10
States like Bihar and Uttar Pradesh, however, have relatively low levels of MNREGA employment on a per-capita basis, and it is their large population size that puts them in this top-five category.
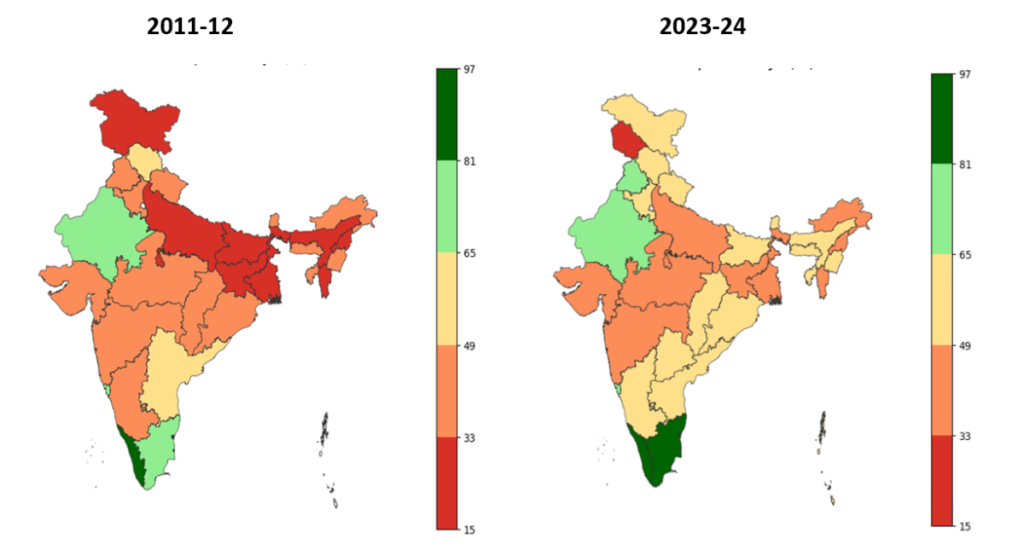
A more informative way of looking at the distribution of MNREGA employment is to divide person-days by rural population, state-wise. Figure 2 presents these per-capita employment figures in two maps, one for each of the two reference years mentioned earlier (2011-12 and 2023-24).11
In both years, seven major states had relatively high levels of MNREGA employment on a per-capita basis: Andhra Pradesh, Chhattisgarh, Himachal Pradesh, Kerala, Rajasthan, Tamil Nadu and Telangana.12 All of them are known for earnest implementation of MNREGA. The highest levels of MNREGA employment, however, are found in some of the smaller north-eastern states, and Ladakh in 2023-24.
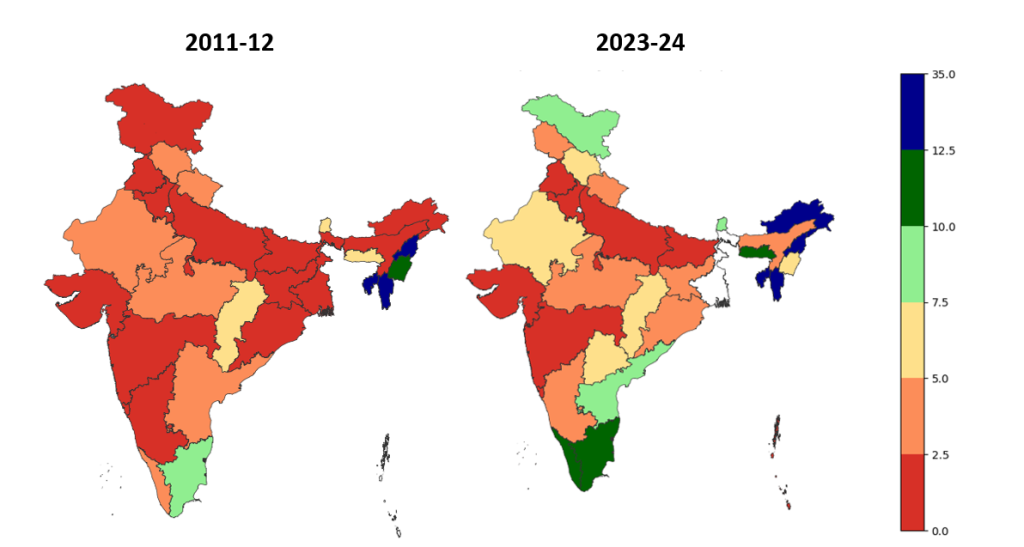
At other end of the spectrum, MNREGA was barely operational in several states in 2011-12, including some with a large population, such as Bihar, Gujarat, Odisha, Maharashtra and Uttar Pradesh. By 2023-24, the programme had picked up in some of these states, but MNREGA employment levels remained very low in Gujarat and Maharashtra.13
This is perhaps not surprising in the case of Gujarat, a relatively well-off state where the political leadership has never shown much interest in MNREGA. Maharashtra’s inertia is harder to understand, considering that this state pioneered the idea of employment guarantee with its own rural employment guarantee Act in the 1970s.
MNREGA and baseline poverty
As the preceding section illustrates, high levels of per-capita MNREGA employment can be found in poor states (for example, Chhattisgarh) as well as in relatively well-off states (for example, Tamil Nadu), just as low levels of employment can be found in poor as well as better-off states (for example, Bihar and Gujarat, respectively).
Sometimes, it is argued that there is an overarching problem of “reverse targeting” across states, in the sense that MNREGA funds are disproportionately spent in well-off states. In fact, the Ministry of Rural Development recently formed a committee to look into this matter, among others, possibly hoping that the committee would recommend capping MNREGA expenditure in better-off states. The committee’s report is not in the public domain (despite repeated requests for it under the Right to Information Act), but according to some media reports, it did oblige the ministry to some extent.14
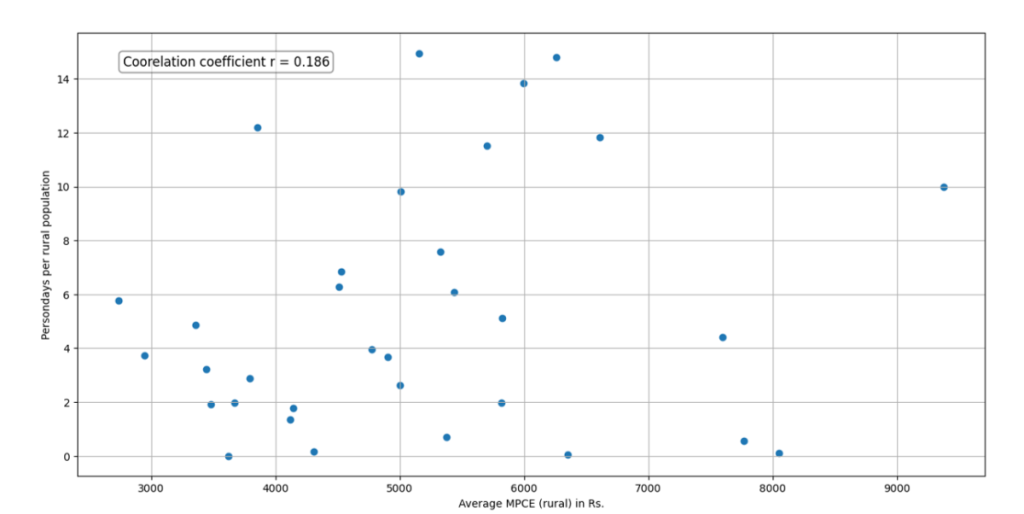
The fact of the matter is that there is no evidence of reverse targeting across states. The point is illustrated in Figure 3, with 2023-24 as the reference year. In this chart, we plot per-capita MNREGA employment against NSS estimates of monthly per-capita expenditure (MPCE) in rural areas, in the absence of poverty estimates for that year. There is no significant correlation between the two.15
For 2009-10 and 2011-12, rural poverty estimates are available, but once again, they have no particular association with MNREGA employment per capita.
Of course, one might still wish for a strong positive correlation across states between baseline poverty and MNREGA employment. It would certainly be useful if poor states like Bihar and Jharkhand accounted for a larger share of MNREGA employment and expenditure.
It is hard to tell whether state capacity or political will is the main stumbling block – quite likely, both are lacking. The fact remains that capping MNREGA expenditure in better-off states is unlikely to help. Further, it would go against the fundamental principle of “work on demand”, and drive MNREGA into a slippery slope of state-specific expenditure caps.
It is important to note that within states, MNREGA employment is relatively well targeted, as one might expect. Anyone who has visited MNREGA worksites would know that most workers there come from poor households. This is also clear from a number of studies (see, for example, Liu and Barrett (2013)).
Seasonal patterns
An important aspect of the countercyclical role of MNREGA is that employment generation is largely concentrated in slack agricultural seasons. The point is illustrated in Figure 4, for 2023-24. In this as in other years, MNREGA employment peaked in April-May-June. In large parts of India, these are the dry summer months, when there is little to do in the fields. These three months accounted for more than 40% of MNREGA person-days in 2023-24.
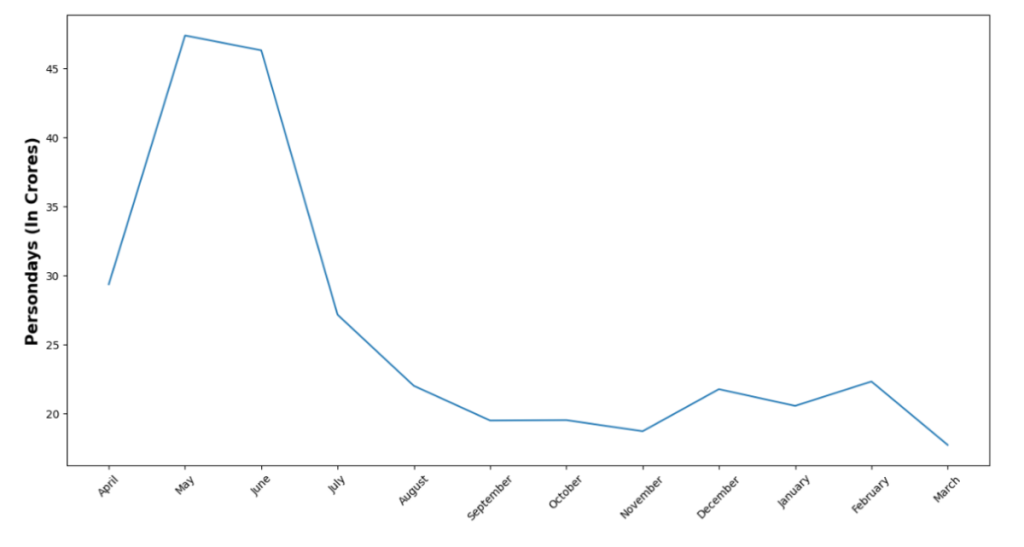
Surprisingly perhaps, a fair amount of MNREGA work also happened in July 2023 – monsoon season in the bulk of India. It is possible that some of this work actually happened in the summer and ended up being post-dated for one reason or another.16 During the rest of the year, MNREGA employment hovered around 20 crore person-days per month.
Such is the picture for 2023-24, but the national distribution of MNREGA employment over the year is quite similar in other years as well. At the state level, there are significant variations, partly reflecting local patterns of agricultural activity.
Women’s participation
From its inception, MNREGA has attracted rural women in large numbers. There are various reasons for this: MNREGA is a rare opportunity for them to earn their own income, work is available close to the home, the work environment is relatively safe and women are paid the same as men.
Some women also consider sarkari kaam (government work) as relatively dignified (Khera and Nayak 2009). The Act prescribes that “priority shall be given to women” in the allocation of work “in such a way that at least one-third of the beneficiaries shall be women”, but in most states, no special measures were required to meet this “quota” – it happened on its own.
Women’s share of MNREGA person-days, already close to 50% at the national level when the programme was extended to the whole country in 2008-09, has been rising over time (Figure 5). Today, it is close to 60% and still rising. This may look like a positive trend, but it must be seen in the light of the stagnation of real MNREGA wages, discussed below. When MNREGA wages are substantially below market wages, as is the case today in large parts of the country, participation tilts towards those who have relatively little access to the labour market, including women and elderly persons.
As with employment levels, women’s share of MNREGA employment varies widely between different states – see Figure 6 (two maps, for 2011-12 and 2023-24 respectively).
In several states, mainly in north India, women’s share remained below the prescribed minimum of one-third for quite a few years after the inception of the programme. In 2011-12, this minimum norm was yet to be met in Bihar, Jharkhand, Uttar Pradesh, West Bengal, Jammu and Kashmir, and several north-eastern states. By 2023-24 (in fact, before that), women’s share of MNREGA work had risen above one-third in all states except Jammu and Kashmir.
Participation of marginalised groups
Scheduled Castes (SCs) and Scheduled Tribes (STs) accounted for 16.6% and 8.6% of India’s population in 2011, respectively (census figures). Their respective shares of MNREGA person-days have been higher all along – see Figure 7. Unlike women’s share of MNREGA work, however, these shares do not follow a simple pattern over time.
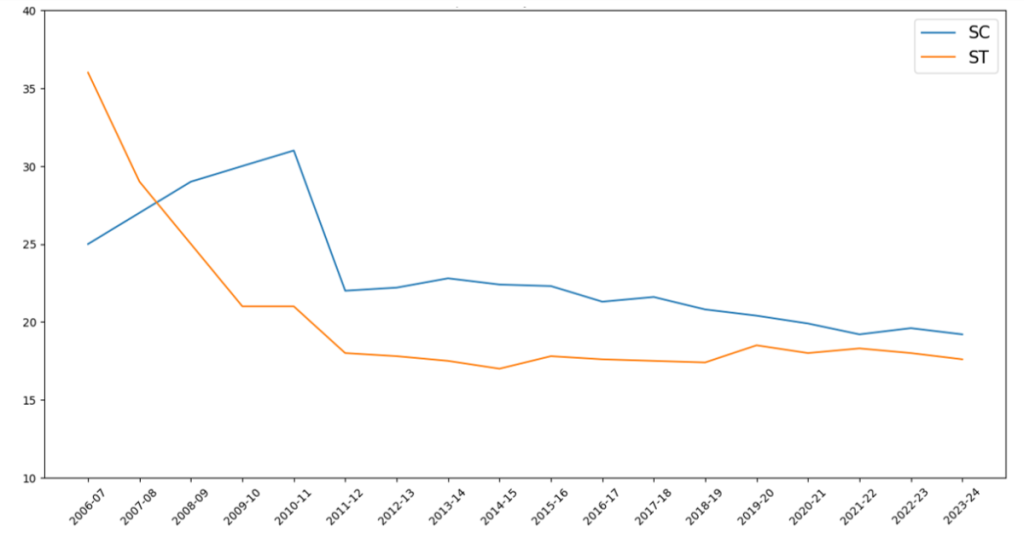
Between 2006-07 and 2010-11, the share of STs decreased steadily while that of SCs increased. There is no puzzle here. This was the period when MNREGA gradually expanded to the whole of India (as mentioned earlier, the Act was extended to the whole country on April 1, 2008, but some states took a little longer to implement it vigorously). Many of the 200 districts where the Act initially came into force, on February 2, 2006, were districts with a large ST population. As the programme expanded, the share of STs in MNREGA employment declined, and that of SCs increased.
What is puzzling is that both declined between 2010-11 and 2011-12 – sharply so in the case of SCs. We are not aware of any plausible explanation for this. After 2011-12, the share of STs roughly maintained itself, but that of SCs declined a little more (from 2013-14 onwards).
Despite this decline, the combined share of SCs and STs in MNREGA work in 2023-24 (37%) was still much higher than their combined population share (around 25%). The decline over time may have something to do with the changing distribution of MNREGA between states. It does call for scrutiny in any case. Indeed, this decline occurred in a period when MNREGA wages were going down relative to market wages. In these circumstances, one might have expected the share of SCs and STs in MNREGA employment to rise rather than to decline.
Real wages
In the initial scheme of things, MNREGA workers were entitled to the minimum wage applicable to agricultural workers in the relevant state, under Section 6(2) of the Act. MNREGA wages were often higher than market wages, significantly so in some states.
In 2009, the Union government changed gear and activated Section 6(1) of the Act, which empowers it to set MNREGA wage rates. A uniform norm of Rs 100 per day was introduced, with top-ups in a few states where the minimum wage for agricultural workers was higher than that.
From then on, the Union government raised MNREGA wages every year to the extent of price increases, state-wise (based on the Consumer Price Index for Agricultural Labourers (CPI-AL)) – no more, no less. In other words, MNREGA wages were frozen in real terms.18
Meanwhile, a new development took place in the labour market: after a prolonged period of very sluggish growth, real agricultural wages started rising steadily around 2007 (soon after MNREGA came into force), until 2014 or so. After that, sluggish growth – if not stagnation – returned. These, at any rate, are the patterns that emerge from Wage Rates in Rural India (WRRI) data collected by the Labour Bureau. They are illustrated in Figure 8.
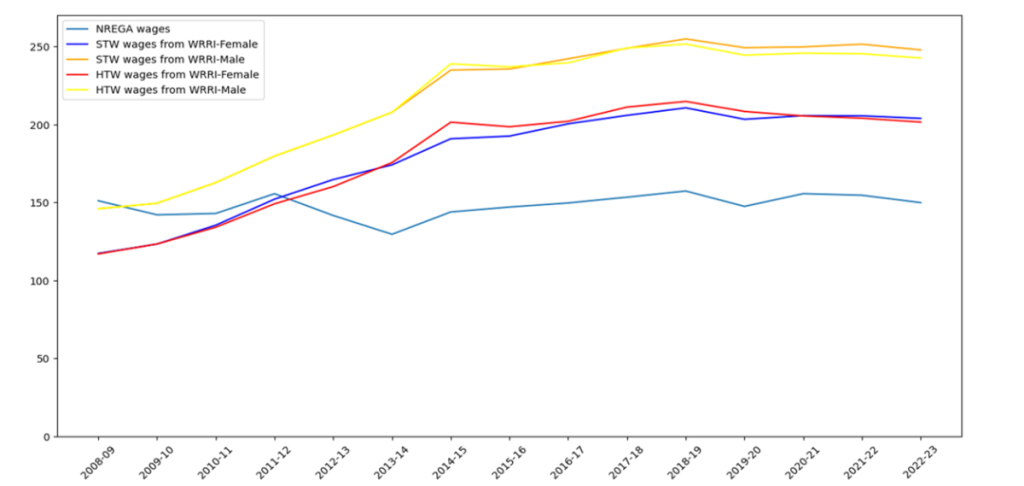
In this chart, all-India MNREGA wages are taken from the MIS, either directly, or – when direct information is not available – by dividing total wage expenditure by the number of person-days of MNREGA employment (both methods produce very similar results in years where direct information is available).
Gender-specific agricultural wages are calculated as an unweighted average over three occupations, separately for early activities (sowing, transplanting, weeding) and harvest-time activities (harvesting, threshing, winnowing).19 They turn out to be much the same for both sets of activities. All money wages are converted into real wages at 2014-15 prices using the CPI-AL.
A clear pattern emerges. Average MNREGA wages were initially a little higher than agricultural wages but then fell behind as they were frozen in real terms while market wages started rising steadily. By 2014-15, MNREGA wages were barely two-thirds of male agricultural wages, and the gap persisted from then on.20
Stagnant real wages, along with chronic payment problems (mainly delayed wage payments but also diverted, rejected or blocked payments), have reduced the attractiveness of MNREGA for many rural workers. There are two possible reasons why this is not reflected in falling employment levels. One is that there was a large unmet demand for MNREGA work in the first place. Another is that a growing proportion of MNREGA person-days are fake. Unfortunately, official statistics shed no light on this.
Administrative expenditure
Figure 9 draws attention to a trend that has gone relatively unnoticed so far: the sharp decline, from 2014-15 onwards, in the share of administrative costs in MNREGA expenditure.
Under the Act, it is the responsibility of the Union government to make an allowance for administrative expenses and to pay for them. The allowance was initially set at a maximum of 6% of total MNREGA expenditure in the relevant state, a norm that applies to this day (Government of India, 2024). Actual administrative expenses rose steadily until 2014-15, to 6% or so, but declined sharply after that, all the way down to the initial levels of 3-4%.
Low administrative expenses may seem to be a good thing, but this is deceptive. Administrative expenses play a critical role in the implementation of MNREGA, because they pay for a huge support structure that includes gram rozgar sevaks (village employment helpers), programme officers, computer operators, junior engineers and other staff – not only their salaries but also the facilities they require. Social audits are also funded from administrative expenses.
The 6% norm is a very modest allowance for this critical support structure. Incidentally, this machinery also has some intrinsic value: it is a critical resource for gram panchayats (village councils) and even block offices, and also makes an important contribution to skill formation. Seen in this light, the sharp decline in the share of administrative expenses from 2014-15 onwards is a matter of concern. Quite likely, it has contributed to the deterioration of MNREGA implementation standards in that period.
Wage payments
Our last chart relates to a critical issue on which MNREGA’s MIS is rather uninformative and even misleading – delays in wage payments. Under the Act, workers are entitled to payment within 14 days. Twenty years down the line, however, this remains an elusive right.
The MNREGA wage payment process happens in two “stages”, before and after the generation of a fund transfer order (FTO). The first stage is the responsibility of the state government, but the second stage is now centralised – payments are made directly by the Union government to workers’ accounts.
According to the MNREGA Rules, each stage should be completed within seven days. In 2016-17, however, the first stage took more than 15 days for almost half of all wage payments, according to a study of wage payments in ten states.21 First-stage delays declined steadily after that, and according to the MIS, they are rare today. Second-stage delays, however, continue, partly because MNREGA funds tend to run out before the end of the financial year, leading to the temporary discontinuation of wage payments.
Second-stage delays are not reported in the MIS. Worse, the Ministry of Rural Development routinely misleads the public with claims of timely payment based on first-stage data.22 A recent study, however, presents estimates of second-stage delays based on an independent analysis of more than 31 million wage payments across ten states in 2021-22 (Bheemarasetti et al. 2025). The main findings are displayed in Figure 10. Clearly, timely payment is the exception more than the rule: only 37% of payments were made within seven days of FTO generation, as prescribed. Nearly half (42%) were delayed beyond 15 days after FTO generation.
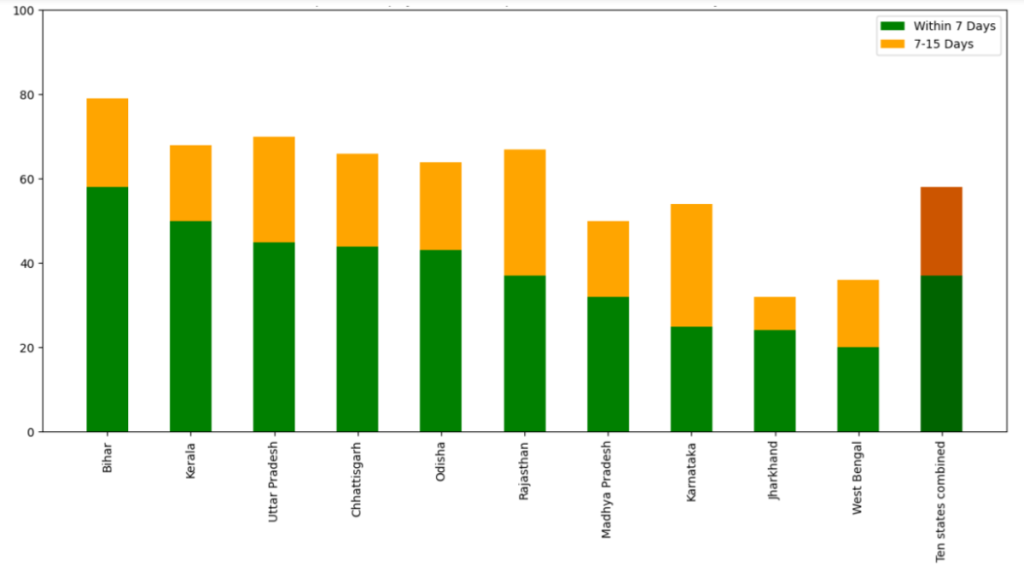
The proportion of wage payments delayed beyond 15 days after FTO generation varied widely across states, from 21% in Bihar to 64% in West Bengal. There is no obvious reason for these contrasts. One possibility is that they reflect different abilities (on the part of state governments) to meet reporting requirements or other conditionalities set by the Union government.
Sometimes, there is a hint of political favouritism. Note, for instance, that the ruling parties in Bihar and West Bengal in 2021-22 were allies and opponents, respectively, of the Bharatiya Janata Party (BJP) (the leading party at the Union government).23 However, there is no clear sign of systematic favouritism.
Another important insight from the same study is that Aadhaar-based payments are not faster than account-based payments. Aadhaar-based payments are routed by the Aadhaar Payment Bridge System (APBS), a futuristic if not byzantine payment system that treats a person’s Aadhaar number as their financial address and automatically sends money to that person’s latest Aadhaar-linked account.24
The reason why this finding is important is that the APBS has caused considerable hassles to MNREGA workers (see, for example, Dhorajiwala et al. (2019)). One of the main justifications for promoting it (and even making it mandatory from January 2024 onwards) was that it would reduce delays in wage payments. In fact, this has not happened.
Concluding remarks
Here ends our short history of MNREGA. If we take official statistics at face value, MNREGA has an impressive record. The programme generates a huge amount of fallback employment for disadvantaged groups, especially in times of crisis. It has shown much resilience over 20 years despite economic contingencies, changes of government and attempted cuts. The picture is all the more encouraging if we read it together with the rich literature on MNREGA’s wide-ranging benefits.25
MNREGA’s achievements, however, are heavily concentrated in a few states. In many other states, the basic principle of work on demand is yet to become a reality, and MNREGA is little more than a large but still top-down public-works programme. These states, unfortunately, include many of India’s poorest states.
Further, it is important to note that the official picture is incomplete, and possibly even misleading in some respects. Official statistics, for instance, tell us very little about the unmet demand for MNREGA work, delays in wage payments or failures of grievance redressal.26 More importantly, it is no secret that MNREGA’s official employment figures are inflated. Indeed, it is principally by inflating worksite attendance sheets (“muster rolls”) that corrupt middlemen siphon off MNREGA funds.
This is one reason why official statistics need to be validated from independent sources such as household surveys. In this respect, there is a gaping hole. The last year for which official MNREGA statistics have been validated from independent surveys is 2011-12. After that, we are in the dark, though some useful information is available from the Periodic Labour Force Surveys.27
Validated or not, official statistics need to be supplemented with further evidence, since they leave out a lot. There are many other useful sources, from case studies and household surveys to social audits. But here again, a few states (such as Andhra Pradesh, Telangana and Tamil Nadu) have received far more attention than others.28 On both counts (validation and supplementation), we need much more information on the ground realities of MNREGA.
MNREGA has shown the viability and sustainability of a rural employment guarantee Act in a poor country. What is yet to be demonstrated is the feasibility of employment guarantee itself – not the same thing, since ground realities often depart from the intention of the Act. The experience so far is an important step towards a practical realisation of the right to work on demand, but there is still a long way to go.
Earlier versions of some of the infographics discussed here are presented in a recent book by Reetika Khera (2025). Very recently, some retrospective MNREGA data was reinstated on the MIS portal (earlier nrega.nic.in, now nrega.dord.gov.in). However, important gaps remain for the early years, up to 2010-11; some of them can be filled from the “monthly progress reports” of that period (as in Government of India (2013)).
Notes
- MNREGA provides a legal guarantee of employment on demand to all adults in rural areas, up to 100 days of work per household per year. Employment is provided on local public works identified through participatory planning at the village level. For an introduction to MNREGA, see Dey et al. (2006).
- Unless stated otherwise, all annual figures in this article refer to financial years.
- MNREGA came into force in 200 districts on February 2, 2006, and in another 130 districts in 2007. On April 1, 2008, it was extended to the entire country.
- See, for example, Abreu et al. (2014) and Yadav (2014). As discussed there, there were also other attempts to dilute MNREGA in 2014-15, including the imposition of state-specific caps on MNREGA expenditure.
- Electronic muster rolls make employment conditional on prior registration of workers on digital worksite attendance sheets. Before this system was introduced, making a formal demand for work was a right but not an obligation: workers were allowed to turn up at a worksite without prior registration.
- In 2023-24, India’s projected adult population was around 900 million (Government of India, 2020, Tables 8 and 17), with a workforce participation rate of 58% (Periodic Labour Force Survey, 2023-24). Assuming 300 days of employment per year conditional on workforce participation, total employment would be around 15,660 crore person-days. In the same year, MNREGA generated 309 crore person-days of work or 1.97% of total employment.
- One hundred days is actually the minimum the government is supposed to guarantee (subject to demand) under the law, but in practice, it is treated as a maximum. Some states, however, have raised this minimum to 125 or 150 days for specific areas or communities.
- Deviations from this co-movement can be explained by reallocation of employment across states, changes in the shares of material and administrative expenses in total MNREGA expenditure, lags in wage payments and so on.
- In 2005, after drafting the law, the National Advisory Council estimated that it might cost 1% of GDP in the initial years of all-India deployment; some critics argued that it would cost a lot more.
- In the intervening period, Telangana was carved out of Andhra Pradesh.
- For 2011-12, we use population figures from the 2011 census. For 2023-24, we use projected populations from the National Commission on Population (Government of India, 2020).
- Strictly speaking, these would add up to six states in 2011-12, when Telangana was still part of undivided Andhra Pradesh.
- In 2023-24, MNREGA was also at a standstill in West Bengal, but the reason for this was the discontinuation of MNREGA funding for West Bengal by the Union government (see note 23 below). In the preceding years, West Bengal had relatively high levels of MNREGA employment.
- See, for example, Angad (2024). One of the recommendations quoted there is as follows: “Special policy interventions will be required to examine alternatives for MGNREGS in states with high to middle wealth index but currently having high use of MGNREGS.”
- The same point applies if observations (that is, states) are “weighed” by rural population.
- In some states, there is (or at least used to be) a practice of post-dating MNREGA work to hide delays in wage payments.
- Strictly speaking, “Jammu and Kashmir” was a Union territory at that time.
- For further details, see Central Employment Guarantee Council (2010). This transition actually happened in three distinct steps: activation of Section 6(1), introduction of the Rs 100 norm, and indexation. The first two happened in 2009, the third in 2010 or perhaps 2011.
- These annual averages were kindly supplied by Arindam Das, joint director of the Foundation for Agrarian Studies.
- In many states, MNREGA wages have also fallen behind minimum agricultural wages (Tamang 2025). The legality of paying less than that to MNREGA workers has been strongly contested (Central Employment Guarantee Council, 2010).
- Inferred from Narayanan, Dhorajiwala and Golani (2019), Tables 4 and 5.
- Just to cite one recent example, on December 3, 2024, in response to a question about the “average duration of [wage-payment] delays”, the ministry answered that 99% of FTOs are generated within 15 days, artfully omitting any mention of FTO processing delays.
- The BJP was actually part of the ruling coalition in Bihar at that time. In West Bengal, the Trinamool Congress (a fierce opponent of the BJP for many years) was in office in 2021-22. In March 2022, the Union government took the unprecedented step of discontinuing MNREGA funds for West Bengal altogether, on grounds of alleged “non-compliance of directives of Central Government”. The fund freeze continues to this day and the allegations are yet to be made public. Even in parliament, the Ministry of Rural Development was unable to provide any details (see Government of India, 2023).
- Aadhaar is India’s unique identity number, linked to biometrics.
- A useful guide to this literature is available at jobguarantee.org in the form of an extensive annotated bibliography.
- Another black hole is the productive value of MNREGA works. We know that some types of MNREGA work are very productive; see Ranaware et al (2015), Bhaskar et al (2016), Drèze and Nair (2023), among others. But we also know that there are many “symbolic” worksites where little productive work happens. Little information is available on the overall productive value of MNREGA works.
- For further discussion, see Drèze and Somanchi (forthcoming).
- The academic literature on MNREGA has been heavily influenced by studies focused on Andhra Pradesh and Telangana, where some useful surveys have been conducted (for example, the Young Lives Study) aside from randomised controlled trials (Muralidharan et al. 2023). For many other states, little material is available.

