


India’s 2024 Poverty Data Reassessment: 5 Key Findings Experts Say Challenge Official Decline Claims
India’s 2024 poverty data reassessment reveals 5 key findings that experts say challenge official decline claims, raising important questions about the methods and metrics behind reported progress.
The Paradox of Progress
In recent years, India has witnessed the release of multiple datasets indicating a sharp decline in extreme poverty. Two major sources—one from Indian economists C. Rangarajan and S. Mahendra Dev, and another from the World Bank—suggest a dramatic fall in poverty levels. According to Rangarajan and Dev’s analysis of the Consumption Expenditure Survey (CES) 2022-23 and 2023-24, extreme poverty in India declined from 29.5% in 2011-12 to 9.5% in 2022-23 and further to 4.9% in 2023-24. The World Bank, using its USD 2.15 PPP per day metric, observed a decline from 16.2% in 2011-12 to just 2.3% in 2022-23.
This seemingly rapid improvement has triggered both celebration and skepticism. The core question remains: how do we reconcile these dramatic poverty reduction claims with ground realities like widespread child undernutrition, persistently high illiteracy rates, and overwhelming informal employment?
This multi-part report explores the divergence between poverty statistics and lived experiences in India. It aims to dissect methodologies, evaluate international standards, cross-examine developmental indicators, and investigate the relationship between poverty, nutrition, education, and labour vulnerability. By the end of this analysis, we hope to understand whether the current narrative of poverty decline holds up under comprehensive socio-economic scrutiny.
…
Understanding the Poverty Line — Concepts and Controversies
The definition of poverty in India has been a subject of continual evolution and debate. Historically, poverty estimates have been rooted in nutritional norms, but over time, broader considerations—such as access to healthcare, education, sanitation, and employment—have begun to shape poverty discourse. The two primary poverty line concepts currently used are:
1. Rangarajan Committee’s Definition:
In 2014, the Rangarajan Committee redefined poverty in India as the simultaneous satisfaction of three nutrient norms and minimal non-food expenditures. According to the committee, the poverty line in 2011-12 was Rs. 972 for rural areas and Rs. 1,407 for urban areas per capita per month. In 2023-24, these lines have been updated to Rs. 1,940 (rural) and Rs. 2,736 (urban), which translate to Rs. 64.66 and Rs. 91.20 per day, respectively.
2. World Bank’s Global Thresholds:
The World Bank defines extreme poverty as the condition of living on less than USD 2.15 PPP per day in low-income countries. For lower-middle-income countries like India, the appropriate threshold is actually USD 3.65 PPP per day. However, the Bank’s most recent estimates for India still use the USD 2.15 benchmark, a point of contention that significantly affects the reported poverty rate.
Critical Concerns:
- Misaligned Benchmarks: The continued use of outdated poverty thresholds (both domestic and global) raises concerns about the underestimation of deprivation.
- Low Daily Expenditure Norms: Can Rs. 64.66 or Rs. 91.2 realistically cover basic nutritional, housing, education, and healthcare needs in today’s inflationary environment?
- Ground Realities vs Statistical Constructs: Do poverty lines capture multidimensional vulnerability?
This section sets the foundation for examining the discord between declining statistical poverty and persistent deprivation indicators in the subsequent sections.
Part 3: India’s Hunger Paradox — Malnutrition Amid Declining Poverty
India is one of the few countries where significant economic growth and falling poverty rates coexist with alarmingly high levels of undernutrition. According to the Global Hunger Index (2024), India ranks 105 out of 127 countries. Its hunger score of 27.3 categorizes it under the “serious” category.
This is surprising considering that over 806 million people receive free food grain rations under government schemes such as PM-GKAY. If food insecurity is supposedly addressed through such mechanisms, why is chronic hunger still prevalent?
The paradox points to systemic issues:
- Quality and diversity of food, not just calories
- Gaps in maternal health and infant feeding practices
- Sanitation-linked nutritional deficiencies (e.g., diarrheal diseases)
Child Malnutrition — A Crisis That Defies Poverty Metrics
India’s child nutrition indicators remain deeply troubling:
- 35.5% of children under 5 are stunted (low height-for-age)
- 18.7% are wasted (low weight-for-height)
- 32% are underweight (low weight-for-age)
These figures are from NFHS-5 (2019-21) and reaffirm that malnutrition in India is structural and persistent. Importantly, these numbers do not align with the claim that only 4.9% of the population lives in extreme poverty.
Stunting and wasting are reflective of long-term nutritional deprivation, disease exposure, and maternal education—not merely low income. Thus, even when poverty is statistically low, a child’s developmental future may remain severely compromised.
Undernourishment in the Adult Population
According to FAO estimates and NFHS data, 13.7% of India’s population remains undernourished. This translates to nearly 195 million people. Adult undernourishment often manifests in:
- Anaemia (particularly among women)
- Low BMI
- Fatigue, poor cognitive output, and high susceptibility to illness
These forms of deprivation are often excluded from narrow poverty calculations but affect productivity and long-term well-being. They reinforce the need to view poverty in broader, multidimensional terms.
Quality of Education — A Structural Deficit
Educational access has expanded in India, but quality remains a pressing concern. As per PLFS 2023-24:
- 20% of the population is illiterate
- 45% have studied only up to Class 5
Moreover, learning outcome surveys such as ASER reveal that even those who have attended school for five years often struggle with basic arithmetic and literacy. This has long-term effects on employment, skill-building, and economic resilience—factors essential for escaping intergenerational poverty.
Informal Labour and Economic Vulnerability
India’s labour force is overwhelmingly informal. More than 90% of the workforce is employed in the unorganized sector, characterized by:
- Low wages
- No job security
- No access to social protection
Thus, while these individuals may earn marginally above poverty thresholds, they live in conditions of precarity and chronic financial instability. A single illness, job loss, or economic shock can push them back below the poverty line.
Health Access and Out-of-Pocket Expenditure
According to the National Health Accounts (NHA), over 50% of health spending in India is out-of-pocket. For the poorest quintiles, this expenditure is catastrophic, often leading to indebtedness and asset liquidation.
Inadequate public health infrastructure, poor insurance penetration, and high medicine costs mean that health shocks remain a major cause of economic setback—another dimension not captured by conventional poverty metrics.
Poverty and Social Exclusion
Poverty in India is deeply intertwined with caste, religion, gender, and geography. Dalits, Adivasis, and Muslims are disproportionately represented among the poor and undernourished. Their social exclusion often prevents access to employment, credit, land, and state entitlements.
These overlapping disadvantages reveal the structural nature of deprivation, which cannot be undone solely through aggregate economic growth.
Conclusion to Section One — The Metrics vs The Reality
The juxtaposition of falling poverty rates with persistent hunger, malnutrition, poor education, and informal employment raises serious concerns about the adequacy of current poverty measurement tools.
While statistical poverty may have declined, multidimensional poverty—defined by the absence of health, education, nutrition, housing, and dignity—remains entrenched.
This section sets the stage for a deeper exploration in the next parts, where we will critique the use of outdated global thresholds like $2.15 PPP, analyze the eligibility criteria for welfare benefits, and explore alternative poverty metrics like MPI (Multidimensional Poverty Index).
India’s Economic Classification and Global Benchmarks
India is officially classified as a lower-middle-income country by the World Bank. This classification places the country in the bracket that should use a poverty line of $3.65 PPP/day, not $2.15. However, much of the poverty assessment, including World Bank’s own 2024 report, still uses the outdated $2.15 figure for India, drastically underestimating the true extent of poverty.
Implications:
- Using $2.15 artificially deflates poverty statistics.
- Poverty estimates become misleading when not benchmarked to a country’s income level.
- Development policies based on these figures risk misallocating resources.
The USD 3.65 PPP Reality Check
If India’s poverty was recalculated using $3.65 PPP/day, the population below poverty could potentially be three to four times larger than the reported 2.3%. Estimates from various independent think tanks suggest the real figure could be closer to 15–20%, if not more.
This adjustment aligns better with data on:
- Hunger
- Health outcomes
- Housing and sanitation
- Wage and employment levels
Inadequacies of Consumption-Based Surveys
India’s poverty data relies heavily on Household Consumption Expenditure Surveys (CES), such as those conducted by NSSO. While these are robust in design, they have notable limitations:
- Underreporting: Wealthier households underreport consumption.
- Exclusion of non-monetary deprivation: Education, health, sanitation, dignity.
- Periodic gaps: Conducted every 5–10 years, often outdated.
There’s a pressing need for high-frequency, multi-dimensional surveys to gauge poverty dynamically.
The Case for Multidimensional Poverty Index (MPI)
The Multidimensional Poverty Index (MPI), developed by UNDP and Oxford, uses a more comprehensive approach. It includes 10 indicators across 3 dimensions: education, health, and living standards.
According to India’s own MPI assessment:
- ~230 million people still live in multidimensional poverty.
- Bihar, Jharkhand, Uttar Pradesh, and Madhya Pradesh report the highest MPI rates.
This method provides a richer, more granular understanding of deprivation.
Public Distribution and Welfare Inclusion Errors
While India’s Public Distribution System (PDS) covers over 800 million people, errors in inclusion and exclusion persist:
- Exclusion errors: Many eligible beneficiaries are left out.
- Inclusion errors: Some ineligible households receive benefits.
Accurate targeting is hampered by outdated SECC data, lack of real-time income tracking, and bureaucratic discretion.
Leakages and State-Wise Disparities
Different states report vastly different outcomes in implementing welfare schemes:
- Tamil Nadu and Chhattisgarh show lower leakage rates due to digitization.
- States like Bihar and UP still struggle with ghost beneficiaries and diverted rations.
Leakages affect not just food grains, but also pensions, housing, and employment programs under MGNREGA.
Access to Housing and Sanitation
While flagship programs like PMAY and Swachh Bharat Mission have expanded basic access:
- Over 70 million people still live in informal settlements.
- Rural sanitation coverage is often overreported.
- Water quality and drainage continue to undermine public health.
These affect dignity and health but are rarely counted in consumption-based poverty estimates.
Credit and Financial Access
Jan Dhan, Aadhaar, and mobile penetration have increased formal financial inclusion. Yet, ground realities show:
- Credit access remains poor for small farmers, informal workers, and women.
- Dependence on informal lenders leads to cycles of debt and impoverishment.
Financial insecurity remains a key component of economic vulnerability.
Environmental Shocks and Poverty Traps
Climate change-induced floods, droughts, and heatwaves disproportionately affect the rural and urban poor. Vulnerability increases due to:
- Asset loss
- Crop failure
- Health burdens from pollution and vector-borne diseases
These shocks, increasingly frequent, are rarely accounted for in poverty measures but push millions back into poverty annually.
Informality, Gender, and Intersectionality
Women, especially in rural areas and marginalized communities, face intersecting vulnerabilities:
- Limited land ownership
- Lower wages for same work
- Burdens of unpaid care work
Without incorporating gender-based deprivation, poverty data offers an incomplete picture. Future measurement must account for such intersectional inequities.
Technological Integration and Poverty Data Gaps
Despite the emergence of real-time data systems like Aadhaar, Jan Dhan Yojana, and mobile-based surveys, India’s poverty data still relies largely on low-frequency, traditional methods such as the Consumption Expenditure Survey (CES) and the Periodic Labour Force Survey (PLFS).
Gaps in technology integration mean:
- Delayed interventions during crises
- Lack of dynamic tracking of poverty transitions
- Failure to capture informal economic contributions
Real-time poverty dashboards, integrated with digital ID and welfare databases, could help design more effective and responsive social protection systems.
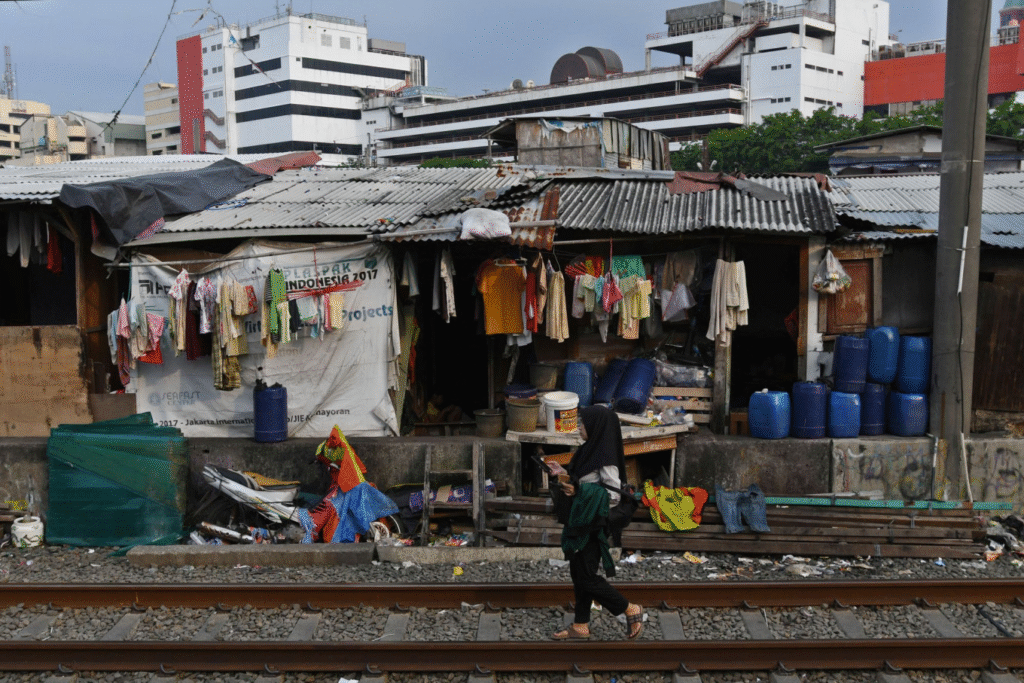
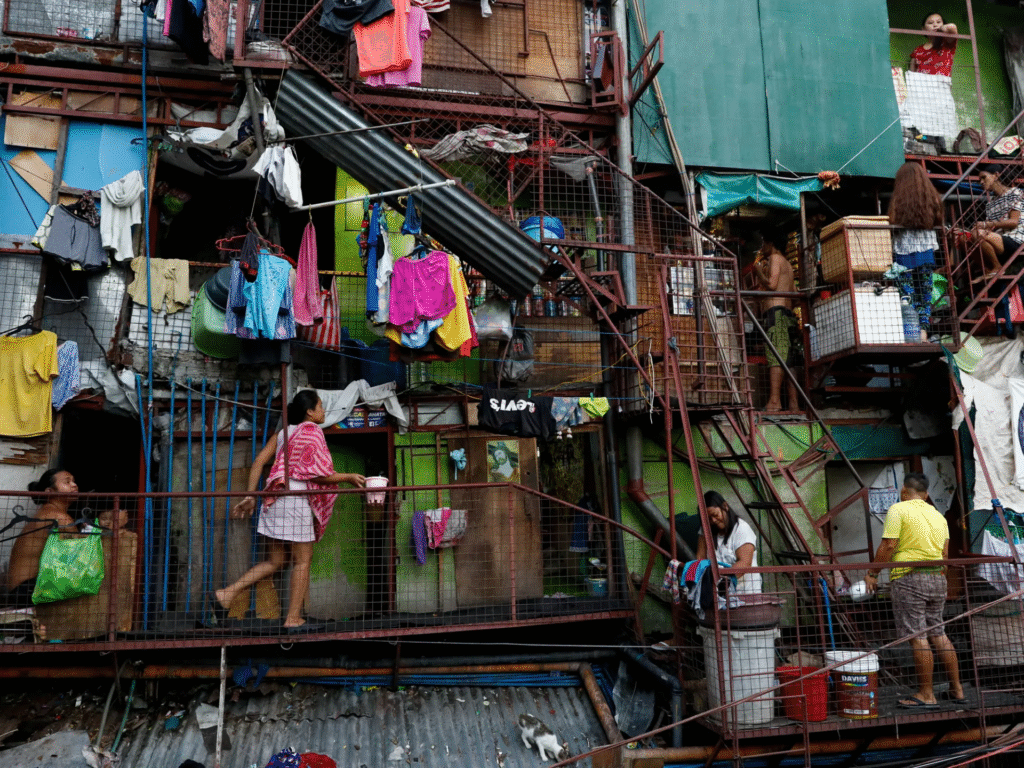
Urban Poverty — The Invisible Crisis
Urban poverty remains underrepresented in national poverty metrics. Slum dwellers, migrant workers, and the homeless often fall outside formal welfare nets. Key challenges include:
- Lack of housing rights and tenure security
- High living costs offsetting income advantages
- Informal employment without benefits or contracts
Census data suggests that over 17% of India’s urban population lives in slums, a number that is likely underestimated. Multidimensional poverty among the urban poor is masked by the averaging effect of aggregate data.
Rural-Urban Poverty Linkages
Migration from rural to urban areas is often seen as a pathway out of poverty. However, most migrants find work in informal sectors and remain vulnerable. Studies show that migrants:
- Often face wage exploitation
- Live in overcrowded rental housing without sanitation
- Lack access to urban ration cards or healthcare
Thus, poverty is transferred, not transformed. Urban policy needs to recognize and integrate migrant livelihoods into urban development plans.
Pandemic’s Lasting Legacy on Poverty
COVID-19 had a profound impact on India’s informal economy. Millions lost jobs, and rural reverse migration surged. Surveys like CMIE and Azim Premji University’s studies estimated that:
- Over 200 million people experienced income loss
- ~75 million were pushed back into poverty
While macroeconomic recovery resumed, recovery at the household level has been uneven. Rising inequality and growing indebtedness remain concerns.
Inequality and the Poverty Narrative
India’s economic growth has not translated into equitable prosperity. Oxfam’s 2023 report states:
- The top 10% hold 77% of national wealth
- The bottom 50% own only 13%
This imbalance affects social mobility, education access, and intergenerational poverty. If poverty is measured solely in absolute terms, it masks the relative deprivation and systemic inequality that persist.
Regional Disparities and Federal Challenges
States like Kerala, Tamil Nadu, and Himachal Pradesh have made significant gains in human development, while states like Bihar, Uttar Pradesh, and Madhya Pradesh continue to lag. The divergence is stark in terms of:
- Literacy and school attendance
- Maternal and child health
- Access to piped water and sanitation
India’s poverty reduction strategy must therefore be state-sensitive, with differential planning and funding mechanisms that address regional gaps.
Social Mobility and Aspirational Poverty
India’s burgeoning middle class masks a large section of the population that lives just above the poverty line. These individuals are highly vulnerable to:
- Inflation
- Health shocks
- Job losses
This “near-poor” or aspirational poor group needs targeted support to ensure intergenerational upward mobility and avoid poverty recurrence.
The Role of Civil Society and Local Governance
Community-based organizations and Panchayati Raj Institutions play a critical role in:
- Delivering last-mile welfare
- Monitoring beneficiary inclusion
- Providing local employment and self-help groups
Strengthening local governance capacities is essential to deepen poverty reduction efforts. Participatory planning and decentralized funding models can bridge administrative gaps.
Innovations in Welfare Delivery
Several innovations have shown promise:
- Direct Benefit Transfer (DBT): Reduced leakages in schemes like PM-KISAN and pensions
- Digital ration cards: Better portability for migrants
- Mobile health clinics: Expanded access to remote regions
However, these need to be scaled with safeguards for data privacy, grievance redressal, and inclusive onboarding of marginalized groups.
Reimagining Poverty Metrics for the Future
India needs a new poverty assessment framework that:
- Uses a multidimensional, dynamic, and disaggregated approach
- Captures intersectional vulnerabilities by gender, caste, and location
- Prioritizes well-being, access, and agency over mere income thresholds
In the coming decade, real poverty reduction will depend not only on GDP growth but on how effectively policies translate into dignified, secure, and equitable lives for all.
Impact of Education on Intergenerational Poverty
Education is one of the most effective tools in breaking the cycle of poverty. However, India’s education system faces several structural challenges:
- High dropout rates at secondary level
- Poor learning outcomes in government schools
- Inequitable access for marginalized groups
According to ASER reports, nearly 50% of Class 5 students cannot read Class 2 texts. Without quality education, children from poor families remain trapped in low-paying, insecure jobs, perpetuating poverty across generations.
Climate Change and Poverty Vulnerability
India’s poor are disproportionately impacted by climate events such as droughts, floods, and heatwaves. Livelihoods dependent on agriculture or informal labor are especially vulnerable.
A recent NITI Aayog report estimates that over 600 million Indians face moderate to high levels of climate risk. Mitigating these risks through:
- Climate-resilient agriculture
- Weather insurance schemes
- Green job training
…can reduce poverty’s climate-related dimensions.
Migration and Remittances
Internal migration plays a critical role in household-level poverty reduction. Migrants often send remittances that supplement rural income. However, they face severe challenges:
- No access to ration cards or healthcare in destination cities
- Unsafe and exploitative working conditions
- Legal invisibility
Portability of welfare services and urban inclusion frameworks are essential to protect migrants’ rights and enhance their contribution to poverty alleviation.
The Cost of Health Shocks
Medical emergencies are a leading cause of poverty. The National Health Accounts 2023 report shows that out-of-pocket expenditure still constitutes over 48% of total health expenditure in India.
Despite schemes like Ayushman Bharat:
- Many private hospitals deny treatment
- Coverage is uneven across states
- Chronic diseases and mental health are poorly covered
Expanding universal health coverage and regulating private healthcare providers is key to reducing health-induced poverty.
Agricultural Distress and Farmer Incomes
Over 60% of India’s rural workforce depends on agriculture, yet farmer incomes remain low and volatile. Key concerns include:
- Rising input costs
- Inadequate MSP implementation
- Climate variability
Doubling farmer incomes, a declared policy goal, remains distant. Without sustained reforms in procurement, crop diversification, and agro-processing, rural poverty will persist.
The Role of Cooperatives and Social Enterprises
Community-based organizations like dairy cooperatives, SHGs, and producer companies have proven to uplift rural households. Examples include:
- AMUL (dairy)
- Kudumbashree (women’s empowerment)
- Fabindia (artisanal retail)
Scaling such models with proper financing and capacity-building can create sustainable income streams and reduce dependency on subsidies.
Digital Divide and Exclusion
While digital India promises inclusion, many poor households lack smartphones, internet access, or digital literacy. This affects:
- Access to online education
- Digital banking and welfare payments
- Skill training and e-governance services
Bridging the digital divide requires not only infrastructure, but localized training, multi-language interfaces, and community-based support systems.
Housing Insecurity and Homelessness
A 2021 report by the Ministry of Housing and Urban Affairs estimated that more than 1.8 million people are homeless in urban India. Housing insecurity leads to:
- Loss of dignity and safety
- Exclusion from welfare programs
- Poor physical and mental health
Policies like PMAY must ensure:
- Slum upgrades
- Affordable rental housing
- Inclusion of the urban homeless
Food Insecurity and Nutrition
Despite the success of the National Food Security Act (NFSA), issues remain:
- Leakages and exclusion errors in PDS
- Nutritional deficiencies among children and women
- Limited dietary diversity
As per NFHS-5:
- 35.5% of children under 5 are stunted
- 18.7% are wasted
Combating hidden hunger requires diversified food baskets, community nutrition campaigns, and locally sourced solutions.
Monitoring, Evaluation, and Transparency
Without transparent and timely data, poverty reduction efforts lack accountability. Key reforms include:
- Publishing granular, district-wise poverty maps
- Open access to CES and PLFS datasets
- Independent third-party audits of welfare schemes
Only with a robust monitoring framework can we ensure that poverty numbers reflect ground realities—and that corrective policies can be promptly implemented.
Also Read : Fuel Ban for End-of-Life Vehicles in India Now Effective from November 1
 & Flight Lieutenant (23) Die in Line of Duty")
