


India’s GDP Growth: Why the Last 10 Years Don’t Tell the Full Story
In light of the recent discourse surrounding India’s considerable improvement in the relative position based on the nominal gross domestic product (GDP), it is crucial to assess the situation holistically. Following the periodisation of the ongoing conversation and to maintain consistency, we compare the past three decades, i.e., 2014-2024, 2004-2014 and 1994-2004.
Firstly, India’s improvement in its global GDP ranking is a continuous process rather than a recent phenomenon. Hence, it would be misleading to attribute this solely to the past one decade (see Figure 1).
Figure 1: India’s nominal GDP ranking (1994-2024)
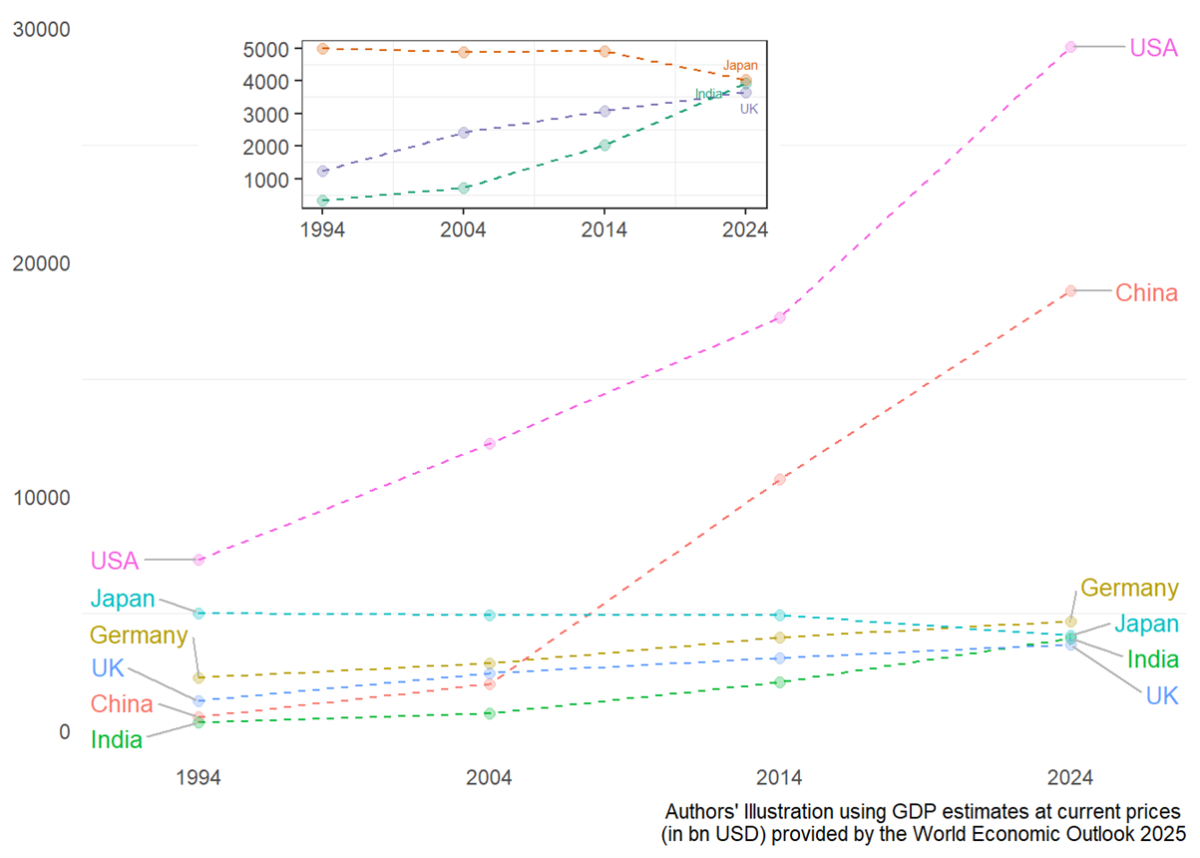
India and China were at a comparable stage in the early 1990s, the latter registering a meteoric rise since. Further, UK and Japan, who were ahead of India in 1994, have not grown rapidly thereafter. While the UK registered a sluggish change recently, Japan experienced a stagnation first, followed by a contraction. This distinction matters because changes in relative position are induced by not only our own progress but also the relative performance of others and not to overlook the huge gap between the top two and the rest in this case.
An inset graph is included in Figure 1 to highlight the nuanced differences in GDP trends among countries such as Japan, India, and the UK. While these nations appear close in overall GDP rankings on the main line chart, the inset reveals clearer trend distinctions, depicting India’s steady improvement over time, that are otherwise difficult to discern.
Figure 2: India’s relative ranking in terms of nominal GDP per capita (1994-2024)
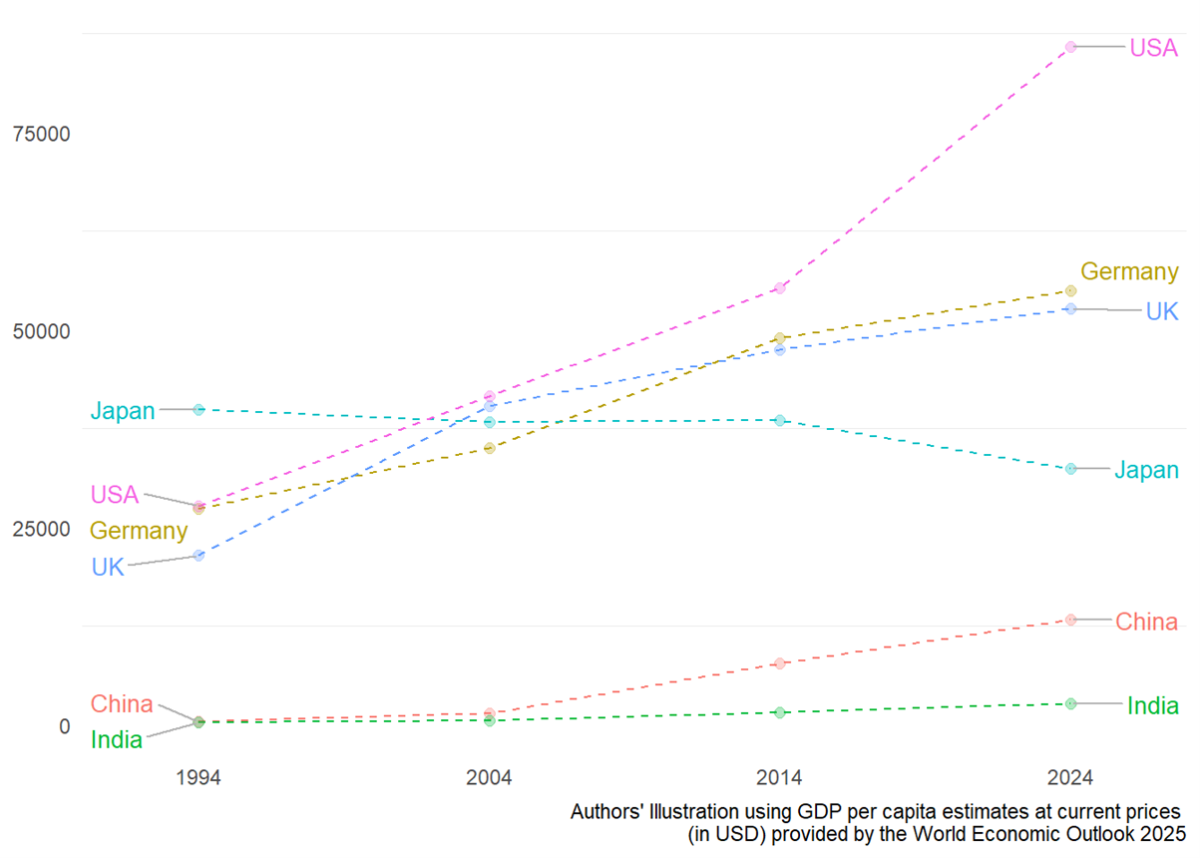
However, in terms of GDP per capita – a better, albeit not sufficient, indicator of living standard than GDP – the relative position of India has not altered much over these years. Here too the improvement of China (in relative terms) and the deterioration of Japan are noticeable.
See Figure 3 where each country is represented by a point in the distribution of countries in terms of GDP per capita. A closer analysis would reveal that about 75 percent of countries are better off than India in terms of GDP per capita while China is better off than 50 percent of the countries in the world in 2024.
Figure 3: India’s relative ranking in global distribution of nominal GDP per capita (1994-2024)
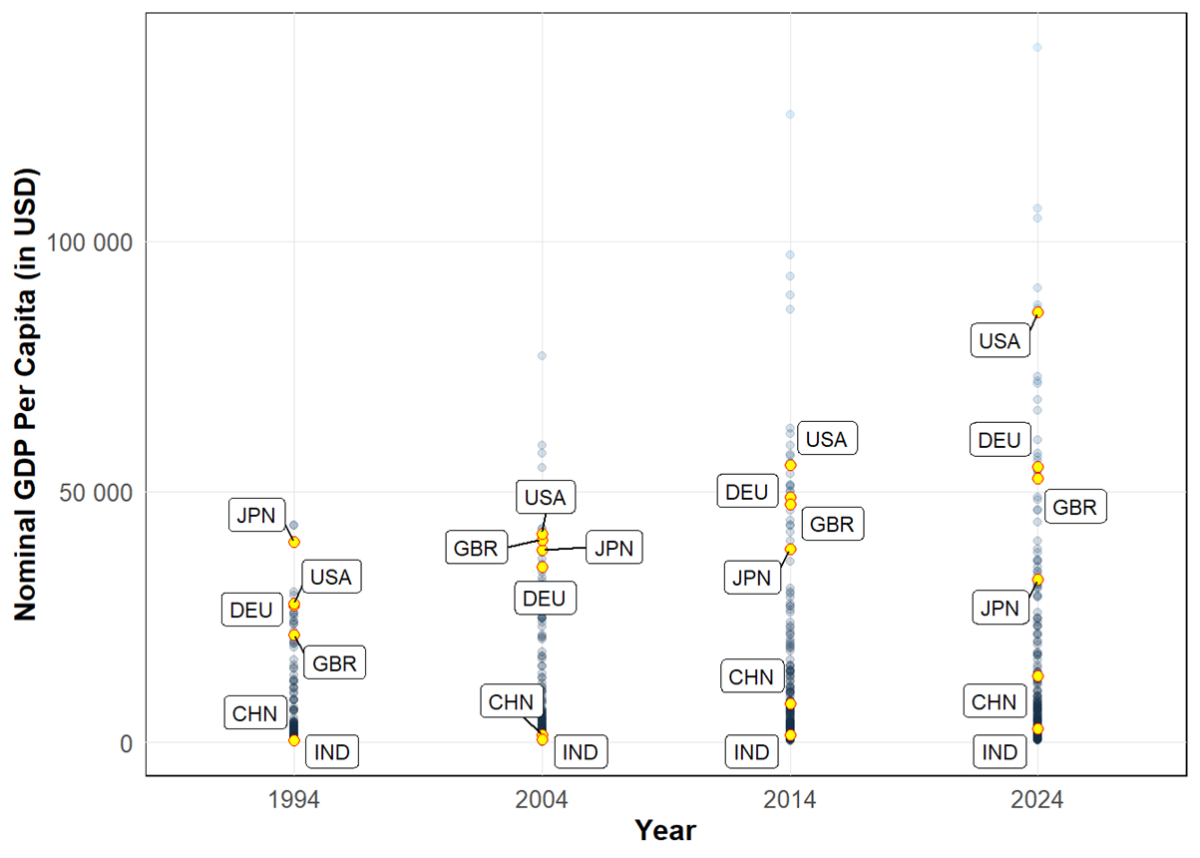
Source: Authors’ illustration using IMF World Economic Outlook data. Note: USA=United States of America; DEU=Germany; GBR=United Kingdom; JPN=Japan; CHN=China; IND=India.
India’s economic performance over time
For any developing country like India, higher and stable economic growth, though not sufficient, is crucial for development. Unfortunately, the last ten years have seen quite the turbulence, even barring the impact of pandemic. In terms of growth in GDP per capita – 2004-2014 saw the highest compound annual growth rate compared to 1994-2004 and 2014-2024 (see Figure 4).
Figure 4: A comparative analysis of growth-related variables
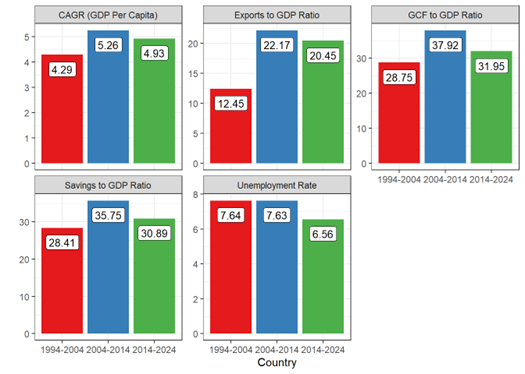
Note: GCF=Gross Capital Formation; CAGR=Compound Annual Growth Rate.
If we look at the year-to-year growth rate we shall see that post-2011 and particularly post-2016 has been a phase of growth slowdown which was exacerbated by the pandemic (see Figure 5).
Figure 5: Trend in year-to-year growth rate across various phases
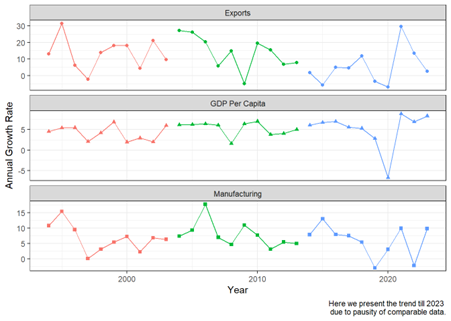
Investment is a crucial driver of aggregate demand and long-term economic growth. Over the past three decades, India’s gross capital formation (GCF) as a percentage of GDP has persistently remained below 40%, suggesting that the economy has not been building adequate productive capacity. This raises concerns about the economy’s ability to generate sufficient demand and employment, thereby potentially compromising India’s future growth prospects.
A review of India’s rate of investment, using GCF to GDP ratio, reveals a significant increase during 2004-2014 period followed by a sharp decline during 2014-2024. The same pattern applies to savings rate, (i.e., savings as a share of GDP) and share of exports in GDP. The manufacturing sector’s performance also has not been very impressive in the recent past (see Figure 5).
Finally, regarding employment generation, post-reform India has seen the infamous “jobless growth”, reflected through the persistent high unemployment rate, even during 2004-2014 which otherwise stands out in terms of income generation, capital accumulation and exports performance.
During 2014 to 2024 there has been a marginal improvement in this regard. However, – (a) the rate of unemployment is relatively higher among the youth and more so among the relatively educated of the lot, and (b) research suggests that growth-driving sectors have hardly created jobs compared to other sectors and the latter, which houses most of the workforce, generates employment mostly of informal kind. Further there is a significant concern regarding how in India we define who is employed.
Unfortunately, the phenomenal increase in income, and achievement of higher growth (especially during 2004-2014) has been accompanied by burgeoning disparity (of wealth and income) and precariousness (in terms of employment). Even during the period of relative growth slowdown concentration of wealth at the top end of the distribution has continued.
A century-long (1922-2023) perspective reveals that high economic growth over the last three to four decades has disproportionately benefited a smaller portion of the population. It is argued that during the period 2014-15 to 2022-23, the wealth and income share of the richest 1 percent has reached a historically unprecedented level, with them claiming more than 22 per cent of the total income and about 40 percent of total wealth.
In fact, the fifth largest economy in the world, lagging behind 75 per cent countries in terms of per capita income, and struggling to rejuvenate its growth momentum, leaves a large segment of its educated youth unemployed and claims a position at the top segment in terms of income share of the richest 1 percent (i.e., in terms of concentration of income and wealth).
And here we do not even refer to the serious air of doubts surrounding the recent GDP series, allegedly overestimating economic growth in the decade of 2010s, and India’s relative position in terms of other development indicators such as human development index (HDI), nutrition, hunger, education, health care services, social discrimination etc.
India’s upward mobility in the global ranking must be acknowledged but not to forget that – a. In terms of GDP per capita we are lagging far behind; b. While we are certainly one of the fastest growing countries, our macroeconomic fundamentals raise serious concerns, and in this regard, as the official estimates suggest, it is not the preceding decade rather the period of 2004-2014 which fared better than both 1994-2004 and 2014-2024.
Also Read: Enemy Is Facing Divine Retribution’: Iran’s Khamenei Delivers Stern Warning After US Strikes

